Strengthening Monitoring, Evaluation and Learning capabilities at the African Population and Health Research Center (APHRC)

Executive overview
This report traces the APHRC engagement from an organization-specific MEL capacity needs assessment through a sequenced training roadmap, tailored Advanced Excel instruction, additional mentoring and participant dashboard submissions. The assessment identified both strong existing MEL infrastructure and gaps in staff use of advanced analytical tools. The completed intervention provided documented opportunities for staff to develop and demonstrate practical analytical skills.
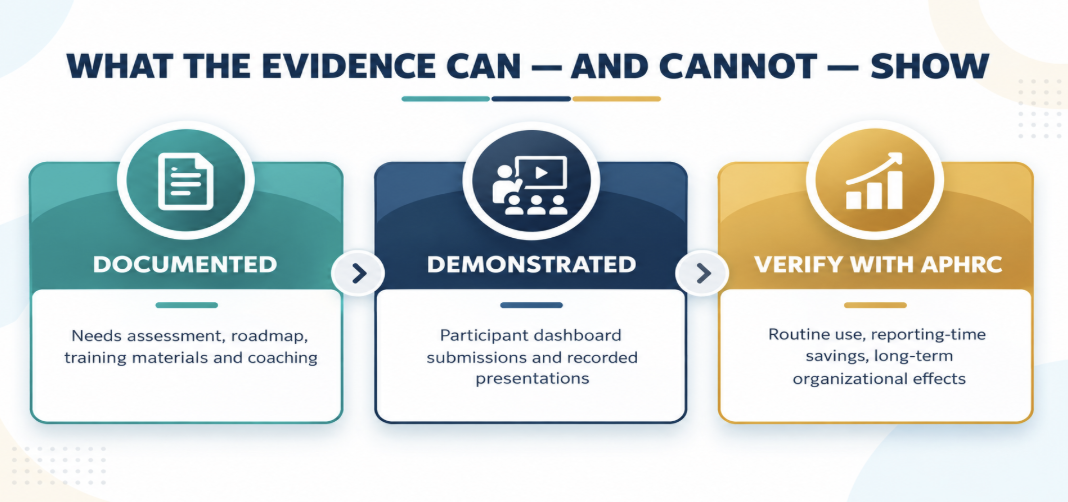
The strongest verified results are the completed needs assessment and roadmap, tailored training materials and follow-up support, and participants’ actual dashboard assignments and recorded presentations.
Engagement at a glance

1 | The context: What challenge brought APHRC to the work?
APHRC approached the engagement with an established Monitoring, Evaluation and Learning framework and a range of data infrastructure, including ERP systems, REDCap, Tableau and a centralized MEL portal. The central challenge was therefore not the absence of MEL systems; it was the uneven capacity to use advanced analytical tools and convert available data into timely, accurate, decision-relevant information.
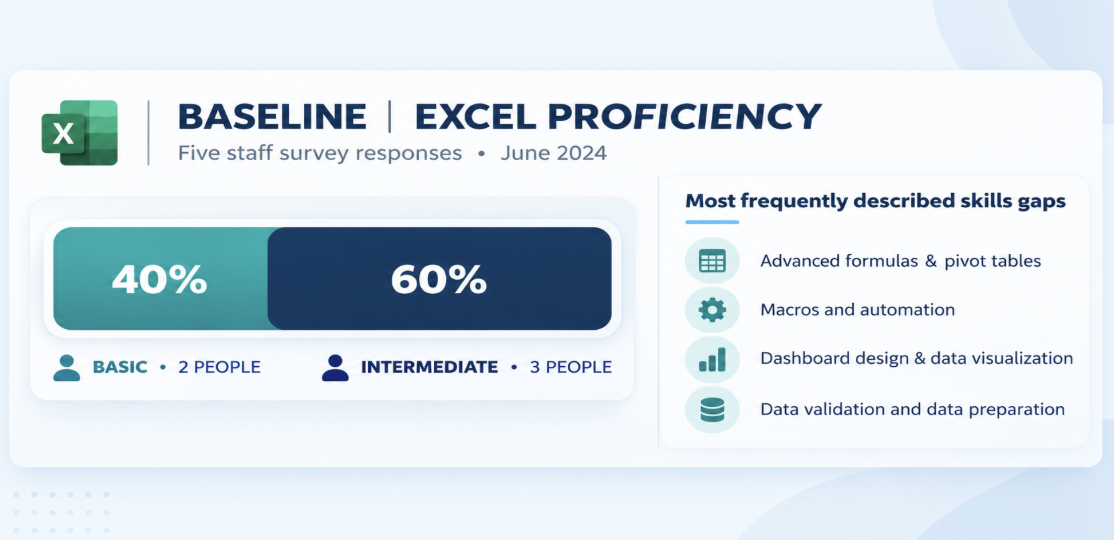
The initial assignment was broader than Advanced Excel. It called for a needs assessment, recommendations concerning analytical tools and an evidence-led training response. Five staff members contributed individual assessment responses, representing M&E, knowledge management and data quality functions. Two described their Excel proficiency as basic and three as intermediate. They reported challenges with complex formulas, macros, dashboards, pivot tables and data validation. Additional needs emerged in Python, R, Stata, qualitative analysis, GIS, evaluation methodologies, knowledge translation and systems integration.
The focus-group findings also raised concerns about reporting timeliness, data quality and effective synthesis of information. These findings made a targeted, sequenced capacity-strengthening approach more appropriate than a generic short course.
2 | Prioritization: Why Advanced Excel first?
Following the assessment, I prepared a capacity-building roadmap spanning 19 thematic areas across 2024–2025. Advanced Excel was placed at the beginning of the proposed sequence because staff already used it in their work, and the baseline established a clear gap between familiar basic functions and more advanced analysis, automation and reporting applications. Beginning with a widely available tool offered an accessible way to address immediate needs while building confidence for subsequent specialist training.
The intervention was therefore designed to strengthen transferable analytical competencies before progressing to more advanced platforms. The selection also reflected the practical nature of the work: staff would benefit most from immediately applying data cleaning, calculated fields, pivot tables, automation and dashboard skills.
3 | The work: What support was delivered?
The Advanced Excel program combined customized preparation, interactive virtual instruction, hands-on exercises and follow-up assistance. The planned 24 hours comprised 12 hours of tailoring content, eight hours of instruction and four hours of follow-up support. Topics included complex formulas and troubleshooting, pivot tables, macros, advanced charting, dashboard design and connections to other analytical tools.
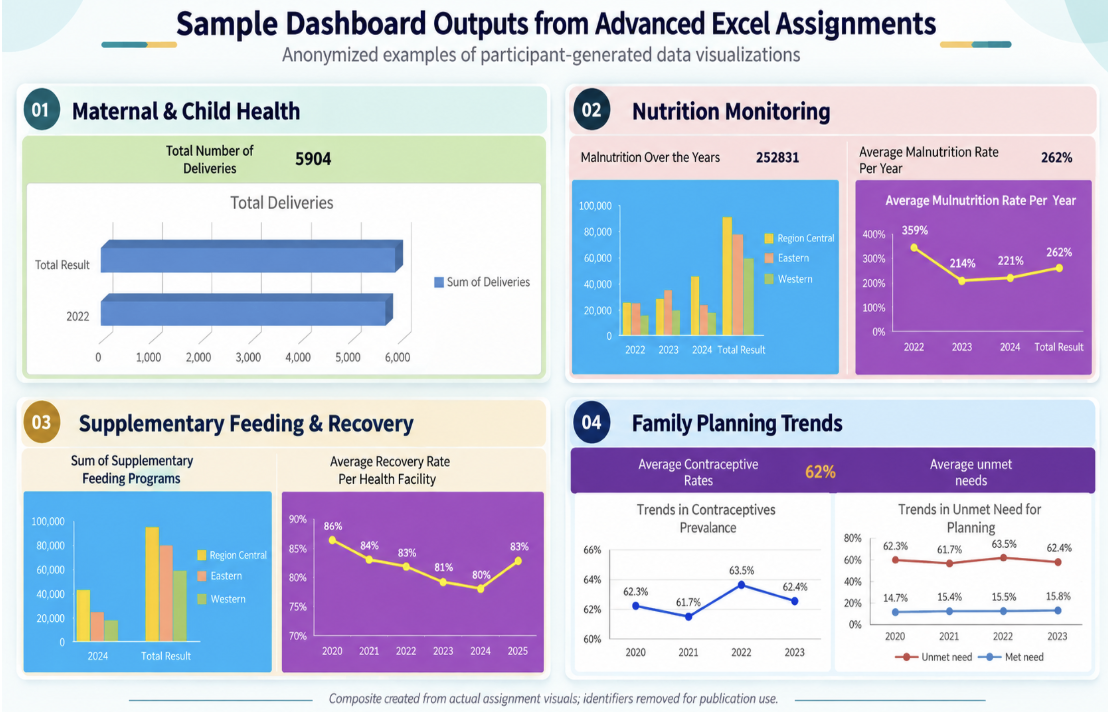
Rather than relying exclusively on generic examples, the training incorporated monitoring and evaluation tasks. The final practical assignment asked participants to clean and integrate health-indicator datasets, apply lookup and error-handling formulas, prepare pivot summaries, create interactive dashboards and record short demonstrations. The assessment criteria emphasized accuracy and completeness (30%), complexity and innovation (30%), and usability and design (40%).
Delivery was adaptive. Some staff grasped concepts quickly, whereas others needed repeated explanations or individual assistance. Competing day-to-day responsibilities also reduced practice time. In response, I adjusted the depth and speed of facilitation, made supplementary materials available and continued assistance through follow-up engagements and MEL Clinics. These responsive practices were subsequently recognized in APHRC’s testimonial.
4 | Outcomes: What changed immediately?
The clearest outcome was visible movement from exposure to demonstrated application. Participants submitted practical Excel assignments and recordings that showed their engagement with the techniques taught. Simon Ambale explicitly said that he had applied the course concepts and that the guidance had improved his Excel skills. Evans Simiyu reported submitting three dashboards and a recording, while other staff submitted workbooks and presentations for review.
The final consultant report describes improved confidence and capabilities in formulas, pivot tables, macros, dashboards and reporting. These observations are consistent with submitted practical work; nevertheless, the available records do not constitute a controlled pre/post competency assessment or quantify organizational efficiency gains. The case study therefore describes enhanced observed capability without inventing percentages, time savings or sustained outcomes.
|
5 | Lasting impact: What remained beyond the sessions?
The engagement intentionally emphasized competencies staff could reuse after the training. The individualized dashboard assignments created concrete artifacts, and the broader assessment produced a roadmap for subsequent organizational development investments. Additional tutorials and coaching helped participants revisit difficult content rather than ending learning at the final classroom session.
The final report recommended periodic refresher courses, peer learning and mentoring, integration of analytical skills into onboarding, and exploration of links to other data and visualization software. These are important sustainability recommendations, but they should not be represented as changes APHRC has already institutionalized. The most defensible lasting contribution at present is the creation of practical skills-building resources, completed learning products and a prioritized pathway for future capability development.
6 | Reflections: What did the engagement teach me?
The experience reinforced that a mature MEL architecture does not necessarily imply uniform user proficiency. Technical infrastructure may be established while individuals still need targeted assistance to use advanced functions effectively. Starting with an assessment was therefore essential: it revealed specific capability gaps rather than assuming the problem was a missing platform.
It also showed the limitations of a single pace for all learners. The strongest response was to adapt delivery, create space for practice and offer additional coaching where necessary. Participant submissions reminded me that training should not be judged only by what the facilitator covers, but also by what learners can independently produce.
The underlying professional lesson was to combine organizational diagnosis, contextualized instruction and relationship-based support. The evidence supports these lessons; it does not establish a particular personal assumption I held before the assignment, so no retrospective “wrong assumption” has been invented.
7 | Grantee perspective: What did APHRC value?
APHRC’s testimonial highlighted reliability, clear explanations, strong guidance and additional support to people who found concepts difficult. The original statement also separately praised Nonprofit Builder coordination, particularly Natasha’s flexibility, communications and budget administration. Both contributions should be recognized accurately rather than merging the consultant and coordination roles.
“He even went the extra mile by offering additional lessons for colleagues who struggled with the material the first time.” APHRC testimonial shared with Nonprofit Builder |
Direct participant feedback complements this testimonial. Simon confirmed skills improvement, and multiple colleagues submitted practical deliverables and recordings. Together, these sources help substantiate a story of responsiveness and skills application, while stopping short of proving long-term organizational impacts.
8 | Visual evidence: What best tells the story?
Three complementary visuals can support publication: (1) a baseline proficiency infographic grounded in the five individual responses, (2) an intervention-pathway diagram tracing assessment through application, and (3) an actual anonymized participant dashboard screenshot, if APHRC approves its disclosure. The first two have been designed for this report. A participant dashboard should only be inserted after permission, removal of any sensitive data and verification that the screenshot truly represents the submitted work.